Optimization of Commercial Rooftop PV Systems in the Continental United States Using Angle-and-wavelength-resolved Solar Irradiance Data
Bowen Zhou*, Cheng Zheng*, and Costas P. Grigoropoulos
38th IEEE Photovoltaic Specialists Conference (PVSC), 002894-002898 (June 3-8, 2012), DOI: 10.1109/PVSC.2012.6318192
Measured efficiency under AM1.5G spectra has been the widely accepted standard to quantify the performance of solar cells. However, the test is carried out at normal incidence of light, while the installed solar panels are subjected to solar irradiation with different angle of incidences (AOI) and spectra most of the time. A lot of research efforts have been devoted into light management for photovoltaic applications [2], as optical losses remain as the main bottlenecks in further improving the cost-effectiveness of today’s crystalline-silicon solar cells. The yearly solar irradiation data, which is resolved in both angle and wavelength, presents an effective and a more realistic approach to quantify the measured improvement in optical properties, such as angle-resolved reflectance spectroscopy data from new antireflection coatings.
Installations of PV systems on residential and commercial rooftops in good sunlight locations may represent the largest PV market potential in the next 10 years, according to a recent McKinsey study [3]. Performance optimization of a given PV system can help reduce the Levelized Cost of Electricity (LCOE) with better energy yield. In a semiannually-fixed tilt configuration , the tilt angle changes twice every year, which is optimized for summer (Apr to Sep) or winter (Oct to Mar) respectively. Recognizing the necessity for regular maintenance to clean dust off solar panels, these changes in tilt angle have the potential to be easily integrated with other regular maintenances with little increase in operating costs.
for different tilt angles
Tilt angle |
Austin, TX |
Berkeley, CA |
Minneapolis, MN (N 44.96) |
||||
Summer |
Winter |
Summer |
Winter |
Summer |
Winter |
||
Year |
0 |
1.500 |
1.370 |
1.505 |
1.287 |
1.499 |
1.174 |
-4 |
1.541 |
1.335 |
1.534 |
1.256 |
1.527 |
1.143 |
|
-8 |
1.559 |
1.300 |
1.563 |
1.208 |
1.549 |
1.110 |
|
-12 |
1.577 |
1.253 |
1.580 |
1.180 |
1.565 |
1.072 |
|
Summer |
-24 |
1.601 |
1.065 |
1.590 |
1.018 |
1.579 |
0.933 |
-26 |
1.599 |
1.043 |
1.593 |
0.986 |
1.577 |
0.908 |
|
-28 |
1.589 |
1.003 |
1.589 |
0.952 |
1.572 |
0.875 |
|
-30 |
1.583 |
0.967 |
1.583 |
0.918 |
1.572 |
0.844 |
|
Winter |
10 |
1.410 |
1.432 |
1.406 |
1.343 |
1.396 |
1.217 |
12 |
1.380 |
1.446 |
1.377 |
1.355 |
1.382 |
1.232 |
|
14 |
1.338 |
1.442 |
1.361 |
1.361 |
1.357 |
1.227 |
|
16 |
1.331 |
1.453 |
1.334 |
1.355 |
1.325 |
1.235 |
|
in the 48 lower continental United States
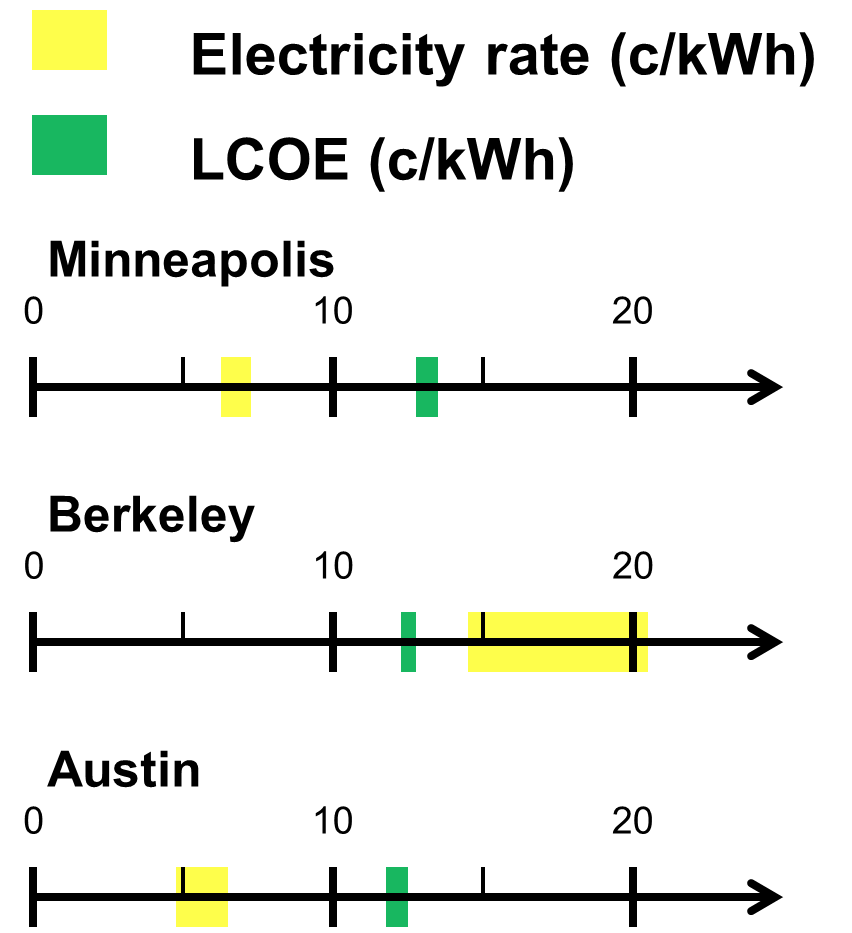
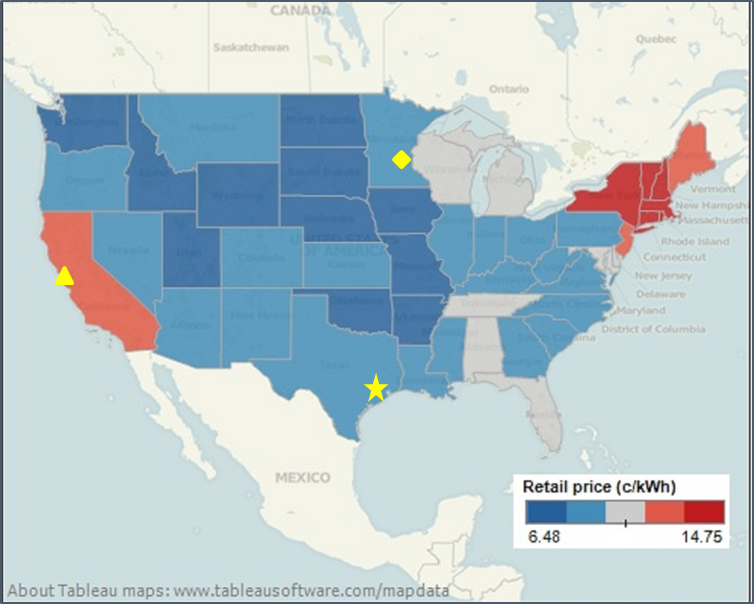
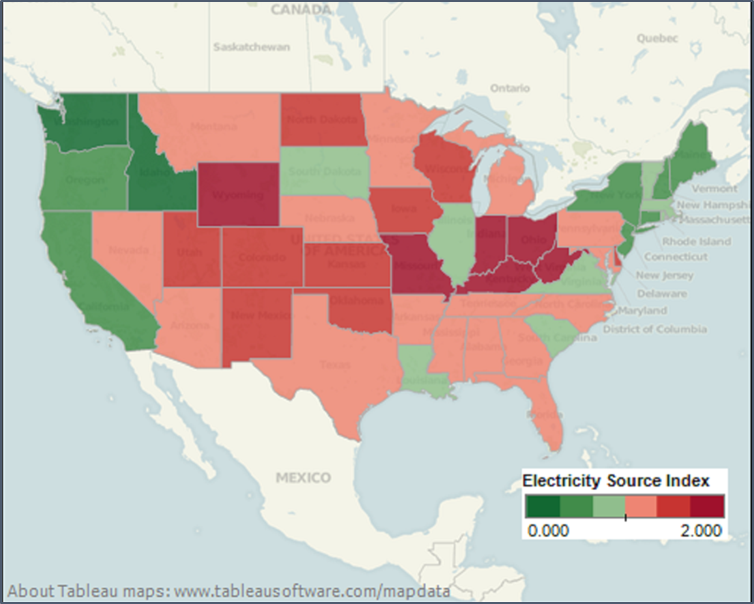
for different tilt configurations
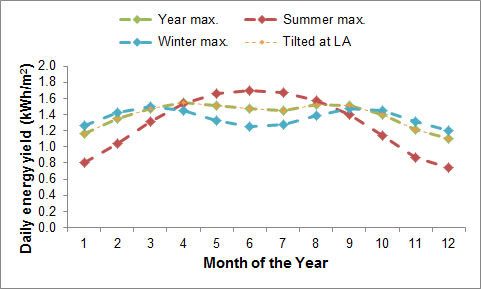
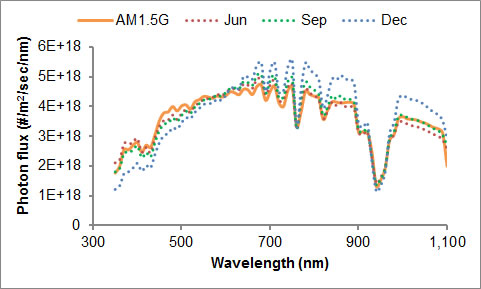
Seasonal Spectrum Shift
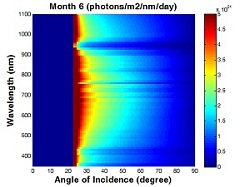
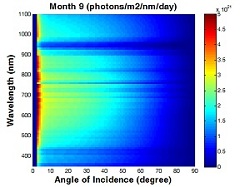
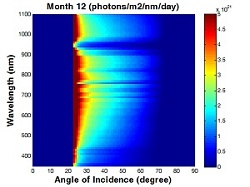
Angle-and-wavelength Resolved Solar Irradiance Map
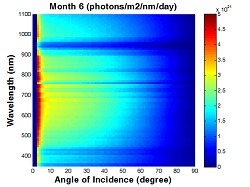
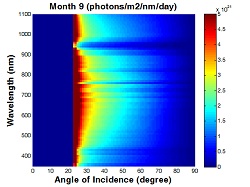
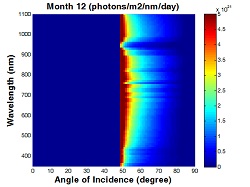
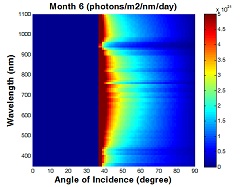
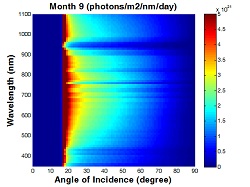
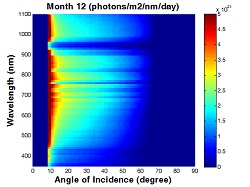
If you need any data underlying the graphs on this webpage
Please address to Andy Zheng
cheng_zheng at berkeley.edu
Subject: Request Solar Irradiance Data
Please be sure to specify the location, tilt angle, and month of year as the following.
City (Austin, Berkeley, or Minneapolis)
Tilt angle (Latitude Angle + 16 14 12 10 0 -4 -8 -12 -24 -26 -28 -30)
Month (Jan to Dec)